How to Tell if Bad Onboarding Is Causing Your Churn
Onboarding failures rarely show up in churn reason codes. Five tests to find the real number in your data, from a one-query check to a blind churn autopsy.


Your churn reasons are lying to you
There is a number in your churn dashboard next to "onboarding." It is probably close to zero.
That number is wrong, and it's wrong in a predictable direction. This post is about how to find the real one. Not estimate it. Find it, in your own data, with a method you can defend in front of a CEO who is going to ask you how you know.
Why doesn't onboarding show up in churn reason codes?
Because the person coding the churn reason is usually the person who ran the onboarding, and because by the time an account cancels there is always a cleaner story available.
What gets recorded is "budget cuts," "champion left," "lack of adoption," "didn't see value." All of those are true. None of them are the cause. They are what a failed implementation looks like nine months later, after everyone involved has moved on and the story has been sanded down into something nobody has to own.
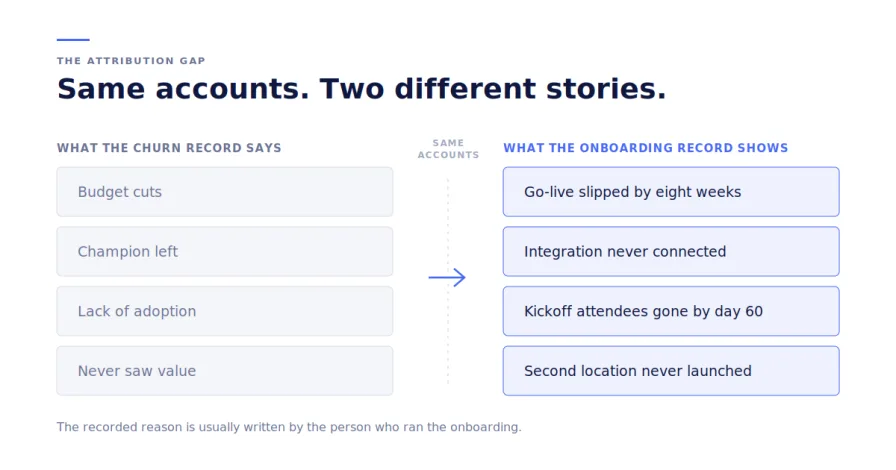
This is not dishonesty. It's a structural bias in how churn reasons get captured, and it biases the onboarding number toward zero at every company that captures churn reasons this way.
The conversation that started this
I was talking with a friend who runs customer success at a mid-market SaaS company. For years, onboarding was on his list of things to fix eventually. It was never the fire. Churn was the fire, and churn had reasons, and the reasons were mostly about budget and stakeholder turnover.
Then he ran an actual churn analysis. Not a report pulled from the CRM. A review of the underlying records.
Over 20% of his churn traced back to onboarding that was bad, incomplete, or never really finished.
Twenty percent had been sitting in his data the entire time, coded as something else.
How do you know if onboarding churn is your problem?
Plot months from contract start to cancellation notice for every account that churned in the last 24 months. Churn concentrated in months 3 through 9 implicates onboarding. Churn concentrated after month 12 usually does not.
Start here, because it takes about a minute and it will tell some of you to stop reading.
 If your churn sits after month 12, onboarding is probably not your problem. You have a value delivery problem, a competitive problem, or a pricing problem, and fixing implementation will not move your retention curve much.
If you see a bulge in months 3 through 9, keep going. That is the shape of customers who never got to the thing they bought the software for, held on through one renewal cycle out of inertia or contract terms, and then left.
Most teams have never looked at this histogram. It costs one query.
What is the difference between onboarding-caused and onboarding-revealed churn?
Onboarding-caused churn is a well-fit customer your implementation failed. Onboarding-revealed churn is a customer who was never going to succeed, where implementation is simply the first place the mismatch became undeniable. Both appear in the record as a stalled onboarding. They require different fixes.
Onboarding-caused churn. The customer bought for a real reason and your process did not deliver. Go-live slipped by two months. The integration never got connected. The admin who was supposed to be trained went on leave and nobody backfilled. The second location never launched.
Onboarding-revealed churn. The fit was wrong, the use case was oversold, or the buyer purchased something the users did not want. Implementation is the first moment where anyone has to actually do the work, which is why it's where the truth surfaces.
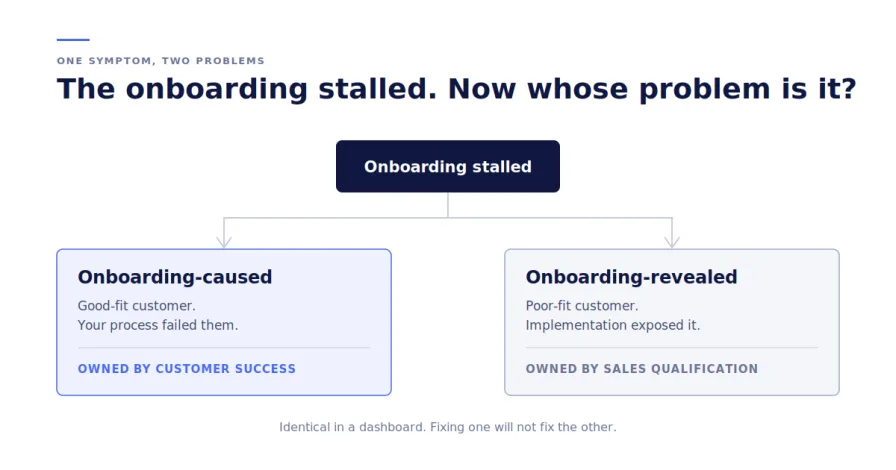
The first one is yours to fix. The second is a qualification problem wearing an onboarding costume, and if you respond to it by adding kickoff calls and check-ins you will spend a quarter and move nothing.
Any credible analysis codes these separately. Most vendor content collapses them, because collapsing them makes the onboarding number bigger.
How do you measure whether onboarding is causing churn?
Five tests, ordered from weakest to strongest evidence. Each costs more than the last and each is harder to argue with.
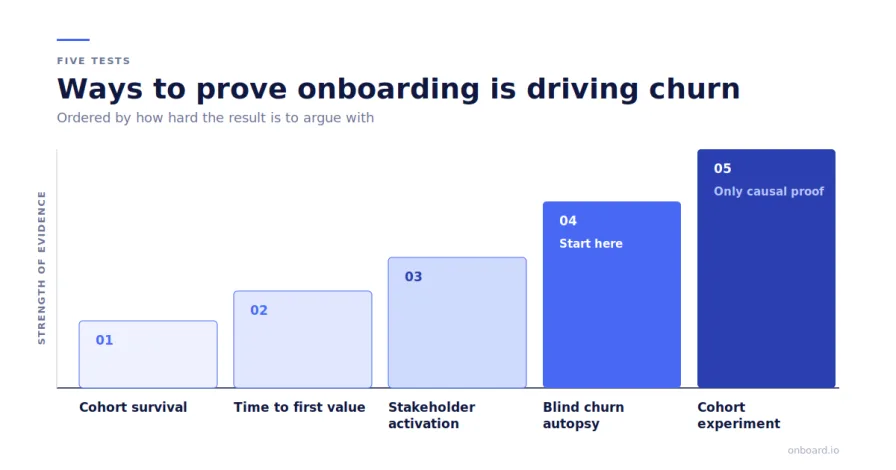
Test 1: Cohort survival split by onboarding completion
Split customers into two groups: those who reached go-live inside your target window, and those who did not. Plot survival at 6, 12, and 18 months.
If the curves separate, you have a signal. You do not yet have a cause. Customers who complete onboarding quickly are often the ones who were already engaged, already well-fit, already staffed to do the work. Completion may be measuring pre-existing health rather than creating it.
Say that out loud when you present this. If you don't, someone in the room will, and you'll lose the argument you were about to win.
Test 2: Time to first value against churn rate
Bucket accounts by days from contract start to first real value. Not first login. Not first invite sent. The actual job the customer bought the software to do: first patient record migrated, first location live, first payroll run, first campaign sent.
Then look at eventual churn rate per bucket.
You are looking for a cliff, not a slope. Slopes are interesting. Cliffs are actionable, because a cliff gives your team a number to manage to. "Get every account to first value inside 30 days" is an operating target. "Faster is better" is not.
Test 3: Stakeholder activation count
Count the distinct people who actually did something during onboarding, per account, and cross that against churn.
Single-threaded accounts die. They die when the champion leaves, when the champion gets reassigned, when the champion goes on leave. If your onboarding process only ever touches one person, you are building a business on one person's continued employment at every one of your customers.
For vertical SaaS this has a specific shape: did the rollout ever get past the pilot site? A customer with twelve locations who only ever went live at one did not onboard. They evaluated, expensively, for a year, and then left.
Test 4: The blind churn autopsy
This is the one that produces a number you can defend.
Pull your last 30 to 40 churned accounts. For each one, read the onboarding record independently of the churn reason that was recorded. Look at:
Planned go-live date against actual go-live date
Which milestones were skipped or marked complete without evidence
Who attended kickoff, and whether those people were still involved at day 60
Whether the integration or data migration ever finished
Support ticket volume and sentiment in the first 60 days
Gaps in the record, meaning stretches where nothing happened at all
Then code each account: onboarding-caused, onboarding-revealed, or unrelated.
Two rules make this worth doing rather than just doing it. First, code blind. Do not look at the recorded churn reason until after you have coded the record, or you will anchor to it every time. Second, have two people code independently and compare. Where you disagree is where the interesting conversation is, and the disagreement rate tells you how much to trust the final number.
Then put your codes next to the recorded churn reasons. The gap between the two columns is the real finding. It is not that onboarding causes churn. Everyone already suspects that. It is that your own system has been telling you a different story for years, and you can now show exactly where it diverged.
Test 5: The cohort experiment
Everything above is correlation. If you want cause, change the process for one cohort and leave another alone, then watch retention.
Pick the single strongest signal from tests 1 through 4. Change one thing about how you onboard, for new customers only, starting on a specific date. Wait for the cohort to mature.
This takes two to four quarters. It's the only evidence that survives a genuinely skeptical CFO. Start it now, in parallel, rather than after you finish arguing about the correlational work.
How much is onboarding-driven churn worth?
Multiply trailing twelve month gross churned ARR by the share you coded as onboarding-caused. That is your recoverable ceiling.
Ceiling, not forecast. You will not fix all of it. But that number is what you are allowed to spend against, and it's usually the first time anyone in the company has seen onboarding expressed as revenue rather than as customer experience.
Then run the same math on the onboarding-revealed bucket and send it to your sales leader, because that one is not yours.
What do you do with the number?
Use it once to size the problem, then throw it away and watch the signals instead.
Churn rate is a lagging indicator. It reports the outcome of a battle you already lost. The autopsy is worth doing exactly once, to establish that the problem is real. Its actual purpose is to tell you which onboarding signals predicted death, so you can watch those signals on the accounts you still have.
If your dead accounts share a pattern of slipped go-live, single-threaded stakeholders, and a milestone that quietly never got completed, then every live account showing that pattern right now is a forecast. That's the shift: from explaining churn after it happens to naming the accounts at risk while you can still do something about it.
Onboarding is not a customer experience investment. It's not polish. It's the earliest reliable read you have on which customers are going to renew, and the last point in the relationship where changing the outcome is cheap.
Run the histogram this week. It's one query, and it will tell you whether the rest of this is your problem.
Frequently asked questions
How do I know if bad onboarding is causing churn? Plot months from contract start to cancellation for every churned account in the last two years. Churn clustered in months 3 through 9 points to onboarding. Then confirm it by re-reading the onboarding records of 30 to 40 churned accounts and coding each one before looking at the recorded churn reason.
Why don't onboarding failures appear in churn reason codes? Because the person recording the churn reason is usually the person who ran the onboarding, and because months have passed by the time an account cancels. The recorded reason tends to be a blameless downstream symptom: budget, champion turnover, or low adoption.
What percentage of churn comes from bad onboarding? There is no reliable industry benchmark, and any vendor quoting one should be treated with suspicion. One CS leader at a mid-market SaaS company found that over 20% of his churn traced to incomplete onboarding after reviewing the underlying records. The only number that matters for your business is the one you produce from your own data.
Is onboarding churn the same as bad-fit churn? No. Onboarding-caused churn is a good-fit customer your process failed. Onboarding-revealed churn is a poor-fit customer where implementation is simply where the mismatch surfaced. They look identical in a dashboard and require different remediation, one in CS and one in sales qualification.
What onboarding metrics predict churn? Time to first value, milestone completion rate, stakeholder activation count, and go-live slippage against plan. These are leading indicators. Churn rate itself is lagging and tells you only about outcomes you can no longer influence.
How many churned accounts do I need to review? Thirty to forty is usually enough to see a pattern. Two independent coders matter more than a large sample, because the disagreement rate between them tells you how much confidence the final number deserves.
More Posts

The True Cost of Bad Onboarding Is Not (Just) Churn

Onboard.io Now Supports MCP: Connect Your Onboarding Data to AI Agents


